- Log in to the WHM.
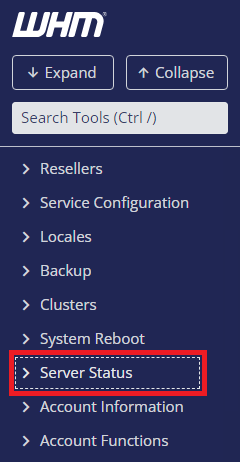
- Select “Server Status” from the navigation menu.

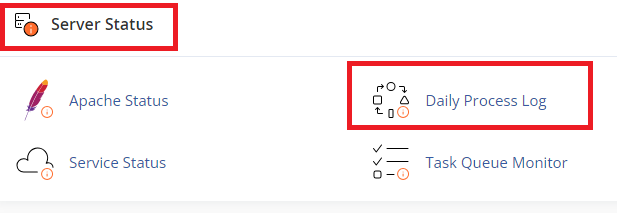
- Click on “Daily Process Log.”

- You can review the logs for the running processes of any day by selecting the dates.
The log will contain two tables:
- The first table will display the percentage of CPU and memory usage of your website(s). Additionally, the last column will contain the average number of MySQL processes for every user.
- The second table, “Top Processes,” will contain a list of processes that the server has deployed for each user. It shows the percentage of CPU usage and the process name.
