
Checking active queries and processes
- Showing the full process list.
-
To display all current operations that MySQL’s processing threads are executing type.
SHOW FULL PROCESSLIST; 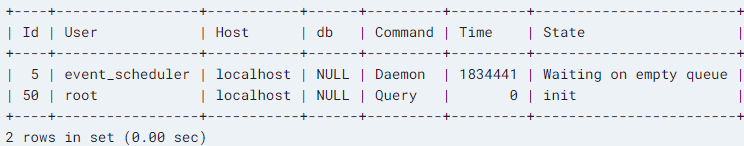
- The output above shows an idle server with only our own query as well as a long running event listener. An active server would show many more processes, some of which might be long running. Without the full modifier, this command will only show the first 100 processes, which may or may not truncate your results depending on your server activity.
- Some of the important parts to take a look at are the time and state columns. The time column counts the number of seconds that the thread has been in the state mentioned. If you find processes with a time value that doesn’t match your expectations for the given operation, it might be time to investigate further.
Checking storage engine status
- Another place to check is the actual storage engine’s status.
- You can find the storage engine associated with a given table by typing:
SHOW CREATE TABLE <database>.<table>\GFor instance, to show the storage engine that the mysql.time_zone table uses type.SHOW CREATE TABLE mysql.time_zone`\G
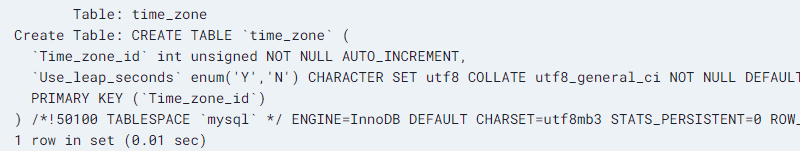
- The ENGINE=InnoDB indicates that the table is using the InnoDB storage engine. This is the default storage engine in most configurations, so you will likely want to check it’s status.
- You can show the InnoDB engine’s status by typing:
SHOW ENGINE INNODB STATUS\G
Enable slow query logging
- Check if MySQL is logging slow queries.
- The first thing you should do is verify the current state of slow query logging. If slow query logging is already enabled, you don’t have to do anything.
- You can check if slow query logging is enabled by typing:
SHOW GLOBAL VARIABLES LIKE ‘slow_query_log%’;
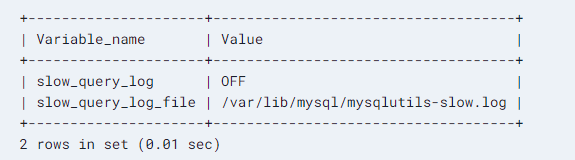
- The above output indicates that slow queries are currently not being logged because the functionality is switched off.
- If slow query logging is on, your output will look something like this instead:
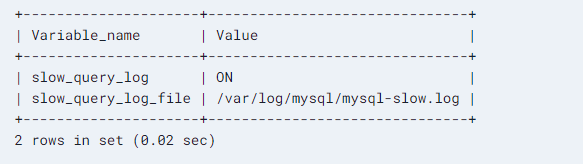
- Now that you know the current state, you can change it as necessary.
Configure MySQL to log slow queries
- Before we move on, it is important to note that while slow query logging is incredibly useful, it can potentially have an additional performance impact. MySQL must perform additional operations to time each query and to record the results to a log. This can impact performance and fill up hard drive space unexpectedly.
- It may not be a good idea to log slow queries at all times. Instead, enable the functionality when you are actively investigating an issue and disable it when you are finished.
- With that in mind, you can configure slow query logging by modifying the MySQL server’s configuration file. You can also modify these values interactively, but setting good defaults in the configuration will make it easier to tweak interactively later.
- Open MySQL’s configuration file. On most Debian Linux-based systems, the configuration file will be located at.
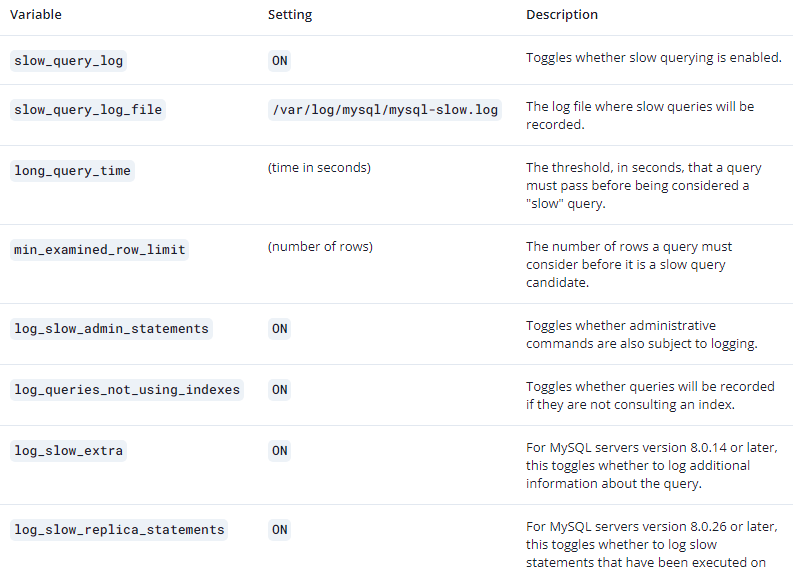
sudo vim /etc/mysql/mysql.conf.d/mysqld.conf - We will want to modify or potentially add the following settings:
Using mysqldumpslow to analyze the slow query log
- Once you have the log that slow query logging produces, you can analyze it in a few different ways to find out where exactly the problems are.
- The simplest way to analyze the log is using the mysqldumpslow utility because it is included in MySQL server installations. To use it, you can point it at the slow query log you generated:
sudo mysqldumpslow /var/log/mysql/mysql-slow.log
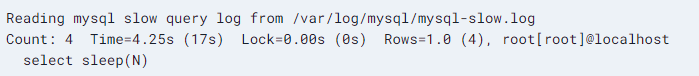
- The above output shows that we have had four queries that were deemed “slow” according to our criteria. They’re all variations of the SELECT SLEEP(); query with different numbers (indicated by the N placeholder) in the command (if you want to test this, make sure min_examined_row_limit is unset). The real time taken to execute the statements was around 17 seconds.
- The mysqldumpslow command includes a few options to control the sorting and display of the output. For example, you can use the -t option to limit the results to the top “N” results. For example, the following shows the top five results:
sudo mysqldumpslow -t 5 /var/log/mysql/mysql-slow.log
- You can change the sort order using the -s options. You can sort by query time (t), lock time (l), rows sent (r), or by the averages of those metrics (at, al, and ar respectively). By default, mysqldumpslow sorts by average query time (at).
- To display the top three queries by their amount of lock time, you could type:
sudo mysqldumpslow -t 3 -s l /var/log/mysql/mysql-slow.log
Using pt-query-digest to analyze the slow query log
- Another popular utility to analyze slow query logs is the pt-query-digest tool developed by Percona. The pt-query-digest tool is part of the Percona Toolkit, a set of open-source command line tools created to help database administrators manage databases easier.
- The first step is to download the Percona Toolkit to your server. You can find the appropriate file by selecting the version of the toolkit you’d like and the platform where you’ll be using it on the Percona Toolkit download page.
- After downloading and installing the version of the toolkit appropriate for your platform, you should have access to the pt-query-digest tool.
- Running pt-query-digest against your slow query log generates a lot more output than mysqldumpslow:
sudo pt-query-digest /var/log/mysql/mysql-slow.log
- The output shows execution time, query size, lock time, rows examined and sent, and more. The pt-query-digest command has a lot of different options for shaping the output and displaying only the items that you are interested in.